A) increases and the equilibrium quantity decreases.
B) decreases and the equilibrium quantity increases.
C) is ambiguous and the equilibrium quantity increases.
D) decreases and the equilibrium quantity is ambiguous.
F) B) and C)
Correct Answer

verified
Correct Answer
verified
Multiple Choice
If a good is normal, then an increase in income will result in an)
A) increase in the demand for the good.
B) decrease in the demand for the good.
C) movement down and to the right along the demand curve for the good.
D) movement up and to the left along the demand curve for the good.
F) A) and C)
Correct Answer

verified
Correct Answer
verified
Multiple Choice
What would happen to the equilibrium price and quantity of lattés if coffee shops began using a machine that reduced the amount of labor necessary to produce them?
A) Both the equilibrium price and quantity would increase.
B) Both the equilibrium price and quantity would decrease.
C) The equilibrium price would increase, and the equilibrium quantity would decrease.
D) The equilibrium price would decrease, and the equilibrium quantity would increase.
F) A) and C)
Correct Answer

verified
D
Correct Answer
verified
True/False
An increase in the price of ink will shift the supply curve for pens to the left.
B) False
Correct Answer

verified
Correct Answer
verified
True/False
Advances in production technology typically reduce firms' costs.
B) False
Correct Answer

verified
Correct Answer
verified
Short Answer
Table 4-15
The following table shows the number of cases of water each seller is willing to sell at the prices listed.
 -Refer to Table 4-15. Assuming these are the only four suppliers in this market, the function for market supply can be written as QS=
Correct Answer

verified
Correct Answer
verified
Multiple Choice
The forces that make market economies work are
A) work and leisure.
B) politics and religion.
C) supply and demand.
D) taxes and government spending.
F) A) and C)
Correct Answer

verified
Correct Answer
verified
Multiple Choice
An increase in quantity demanded
A) results in a movement downward and to the right along a demand curve.
B) results in a movement upward and to the left along a demand curve.
C) shifts the demand curve to the left.
D) shifts the demand curve to the right.
F) A) and D)
Correct Answer

verified
Correct Answer
verified
Multiple Choice
The market demand curve
A) is the sum of all individual demand curves.
B) is the demand curve for every product in an industry.
C) shows the average quantity demanded by individual demanders at each price.
D) is always flatter than an individual demand curve.
F) A) and C)
Correct Answer

verified
Correct Answer
verified
Multiple Choice
Figure 4-18 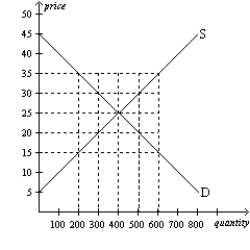 -Refer to Figure 4-18. At what price would there be an excess supply of 200 units of the good?
A) $15
B) $20
C) $30
D) $35
F) A) and B)
Correct Answer

verified
Correct Answer
verified
Multiple Choice
Which of the following might cause the demand curve for an inferior good to shift to the left?
A) a decrease in income
B) an increase in the price of a substitute
C) an increase in the price of a complement
D) None of the above is correct.
F) All of the above
Correct Answer

verified
Correct Answer
verified
Multiple Choice
Figure 4-27
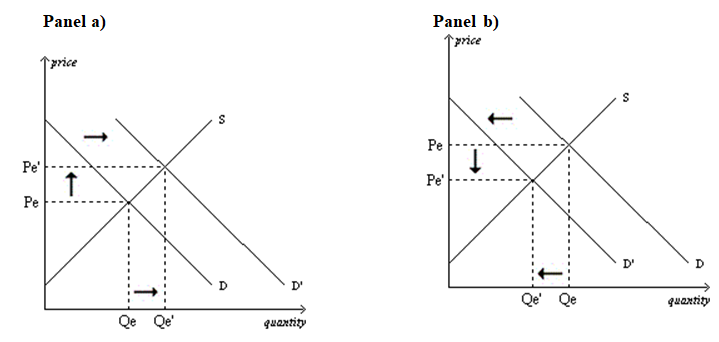
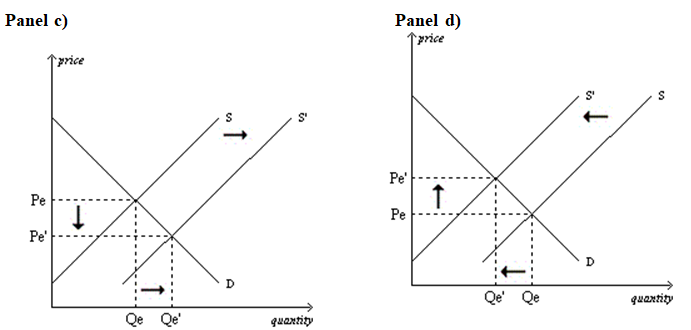 -Refer to Figure 4-27. Which of the four panels represents the market for winter coats as we progress from winter to spring?
A) Panel a)
B) Panel b)
C) Panel c)
D) Panel d)
F) None of the above
Correct Answer

verified
B
Correct Answer
verified
Multiple Choice
Figure 4-25
The graph below pertains to the supply of paper to colleges and universities. 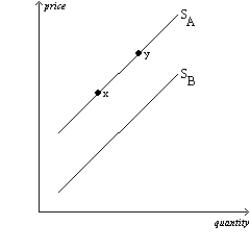 -Refer to Figure 4-25. All else equal, an increase in the use of laptop computers for note-taking would cause a move from
A) x to y.
B) y to x.
C) SA to SB.
D) SB to SA.
F) None of the above
Correct Answer

verified
Correct Answer
verified
Multiple Choice
Which of the following characteristics is required for a perfectly competitive market?
A) The goods offered for sale are exactly the same.
B) There are so many buyers and sellers that no single buyer or seller has any influence over the market price.
C) It is difficult for new sellers to enter the market.
D) Both a and b are correct.
F) B) and C)
Correct Answer

verified
D
Correct Answer
verified
Multiple Choice
Table 4-3
 -Refer to Table 4-3. For whom is the good a normal good?
A) Bert only
B) Grover only
C) Bert, Ernie, Grover, and Oscar
D) This cannot be determined from the table.
F) A) and C)
Correct Answer

verified
Correct Answer
verified
Multiple Choice
Table 4-3
 -Refer to Table 4-3. If these are the only four buyers in the market, then the market quantity demanded at a price of $1 is
A) 4 units.
B) 7.75 units.
C) 14 units.
D) 31 units.
F) A) and B)
Correct Answer

verified
Correct Answer
verified
Multiple Choice
Figure 4-27

 -Refer to Figure 4-27. Which of the four panels illustrates an increase in quantity demanded?
A) Panel a)
B) Panel b)
C) Panel c)
D) Panel d)
F) All of the above
Correct Answer

verified
Correct Answer
verified
Multiple Choice
Figure 4-20 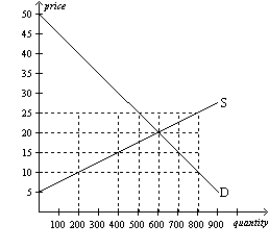 -Refer to Figure 4-20. In this market, equilibrium price and quantity, respectively, are
A) $15 and 400 units.
B) $20 and 600 units.
C) $25 and 500 units.
D) $25 and 800 units.
F) C) and D)
Correct Answer

verified
Correct Answer
verified
Multiple Choice
Figure 4-19 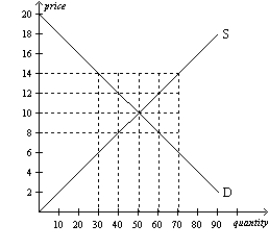 -Refer to Figure 4-19. In this market, equilibrium price and quantity, respectively, are
A) $10 and 30 units.
B) $10 and 50 units.
C) $10 and 70 units.
D) $4 and 50 units.
F) B) and C)
Correct Answer

verified
Correct Answer
verified
Multiple Choice
Figure 4-8 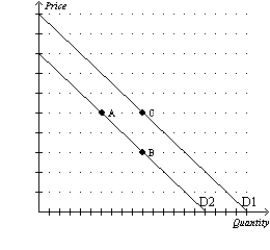 -Refer to Figure 4-8. Suppose the figure shows the market demand for laptop computers. Suppose the price of wireless keyboards, a complementary good, increases. Which of the following changes would occur?
A) a movement along D2 from point A to point B
B) a movement along D2 from point B to point A
C) a shift from D1 to D2
D) a shift from D2 to D1
F) A) and B)
Correct Answer

verified
Correct Answer
verified
Showing 1 - 20 of 697
Related Exams