A) Rising real interest rates
B) Increasing business taxes
C) Lower acquisition cost of capital goods
D) Higher expected rates of return on investment
F) A) and B)
Correct Answer

verified
Correct Answer
verified
Multiple Choice
The slope of the consumption schedule between two points on the schedule is:
A) The ratio of the change in consumption to the change in disposable income between those two points
B) The ratio of the change in disposable income over the change in consumption between those two points
C) Equivalent to one plus the marginal propensity to save
D) Equivalent to the average propensity to consume
F) A) and C)
Correct Answer

verified
Correct Answer
verified
Multiple Choice
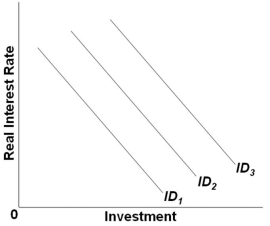
 Refer to the graph above. Which of the following would shift the investment demand curve from ID2 to ID3?
A) A lower real interest rate
B) Rising maintenance costs of investment goods
C) Increasing business taxes
D) Falling stock of capital resources while output is high
F) B) and C)
Correct Answer

verified
D
Correct Answer
verified
Multiple Choice
The relationship between the MPS and the MPC is such that:
A) MPC - MPS = 1
B) MPS/MPC = 1
C) 1 - MPC = MPS
D) MPC - 1 = MPS
F) None of the above
Correct Answer

verified
C
Correct Answer
verified
Multiple Choice
If the consumption schedule shifts downward, and the shift was not caused by a tax change, then the saving schedule:
A) May shift either upward or downward
B) Will shift downward
C) Will shift upward
D) Will not shift
F) All of the above
Correct Answer

verified
Correct Answer
verified
Multiple Choice
If consumers expect prices to rise and shortages to occur in the future, then there will be a shift:
A) Upward of both the consumption and saving schedules
B) Downward of both the consumption and saving schedules
C) Of the consumption schedule upward and of the saving schedule downward
D) Of the consumption schedule downward and the saving schedule upward
F) B) and D)
Correct Answer

verified
Correct Answer
verified
Multiple Choice
If a family's MPC is 0.7, it means that the family is:
A) Operating at the break-even point
B) Spending seven-tenths of any increment to its income
C) Necessarily dissaving
D) Spending 70 percent of its disposable income
F) B) and C)
Correct Answer

verified
Correct Answer
verified
Multiple Choice
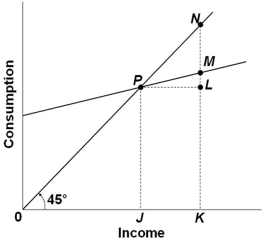
 The graph above shows the relationship between consumption and income. The ratio LM/PL would be a measure of the:
A) Marginal propensity to consume
B) Marginal propensity to save
C) Average propensity to consume
D) Average propensity to save
F) A) and D)
Correct Answer

verified
A
Correct Answer
verified
Multiple Choice
A change in interest rates would shift the consumption schedule and the saving schedule ______; a change in taxes would shift these two schedules ______.
A) In the same direction; also in the same direction
B) In the same direction; in opposite directions
C) In opposite directions; also in opposite directions
D) In opposite directions; in the same direction
F) None of the above
Correct Answer

verified
Correct Answer
verified
Multiple Choice
In a private closed economy, national income is $4.5 trillion and savings equals $6.4 billion. Based on this data, the marginal propensity to consume:
A) Decreases as income increases
B) Is greater than the marginal propensity to save
C) Is less than the average propensity to consume
D) Cannot be calculated from the data given
F) All of the above
Correct Answer

verified
Correct Answer
verified
Multiple Choice
If disposable income is $900 billion when the average propensity to consume is 0.9, it can be concluded that:
A) The marginal propensity to consume is also 0.9
B) The marginal propensity to save is 0.1
C) Consumption is $900 billion
D) Saving is $90 billion
F) B) and D)
Correct Answer

verified
Correct Answer
verified
Multiple Choice
The amount of consumption in an economy correlates:
A) Inversely with the level of disposable income
B) Directly with the level of disposable income
C) Directly with the level of saving
D) Directly with the rate of interest
F) C) and D)
Correct Answer

verified
Correct Answer
verified
Multiple Choice
In general, the steeper the consumption schedule the:
A) Smaller is the marginal propensity to consume
B) Greater is the marginal propensity to save
C) Smaller is the multiplier
D) Larger is the multiplier
F) B) and D)
Correct Answer

verified
Correct Answer
verified
Multiple Choice
The value of the multiplier is likely to fall if there is a fall in:
A) Consumption
B) Income
C) Total spending
D) The marginal propensity to consume
F) None of the above
Correct Answer

verified
Correct Answer
verified
True/False
The marginal propensity to consume is the ratio of consumption to saving.
B) False
Correct Answer

verified
Correct Answer
verified
Multiple Choice
The investment demand curve is drawn with the amount of investment on the:
A) Vertical axis and disposable income on the horizontal axis
B) Horizontal axis and disposable income on the vertical axis
C) Horizontal axis and the expected rate of return and interest rate on the vertical axis
D) Vertical axis and the expected rate of return and interest rate on the horizontal axis
F) B) and C)
Correct Answer

verified
Correct Answer
verified
Multiple Choice
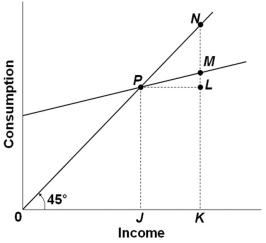
 The graph above shows the relationship between consumption and income. Which of the following statements is correct?
A) The marginal propensity to consume in the economy shown is greater than 1
B) The marginal propensity to consume varies across income levels
C) The average propensity to consume at income level K is given by KM divided by KN
D) The marginal propensity to consume can be calculated by dividing LM by 0K
F) All of the above
Correct Answer

verified
Correct Answer
verified
Multiple Choice
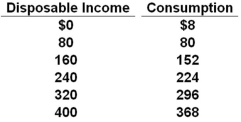
The disposable income (DI) and consumption (C) schedules are for a private, closed economy. All figures are in billions of dollars.  Refer to the data above. The marginal propensity to save in this economy is:
A) .1
B) .72
C) .8
D) .9
F) A) and C)
Correct Answer

verified
Correct Answer
verified
True/False
If disposable income is $350 billion and the average propensity to consume is .80, then personal saving is $70 billion.
B) False
Correct Answer

verified
Correct Answer
verified
Multiple Choice
When the marginal propensity to consume is less than 1, the:
A) Average propensity to consume is greater than 1
B) Average propensity to save is greater than 1
C) Marginal propensity to save is negative
D) Marginal propensity to save is positive
F) A) and B)
Correct Answer

verified
Correct Answer
verified
Showing 1 - 20 of 142
Related Exams