A) A
B) B
C) C
D) D
F) A) and B)
Correct Answer

verified
Correct Answer
verified
Multiple Choice
Which of the following is most consistent with the logistic growth equation,  = rN
= rN  ?
?
A) the number of individuals added per unit time is greatest when N is close to zero
B) the per capita growth rate (r) increases as N approaches K
C) population growth is zero when N equals K
D) the population grows exponentially when K is small
F) A) and D)
Correct Answer

verified
Correct Answer
verified
Multiple Choice
Use the graph to answer the following question. 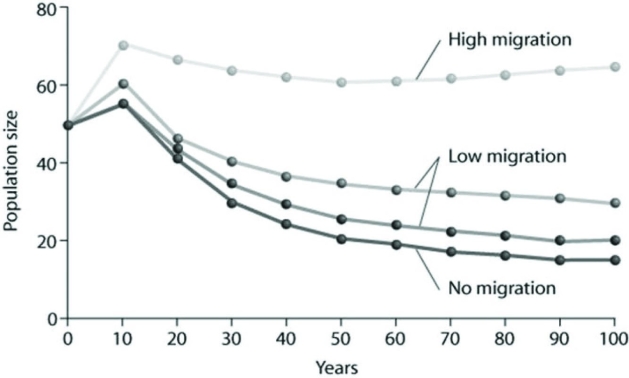 Based on the data provided, what factor of those listed below appears to be the most important in stabilizing the population from its initial size over the subsequent 100 years?
A) The absence of migration
B) A low migration rate
C) A high migration rate
E) None of the above
Correct Answer

verified
Correct Answer
verified
Multiple Choice
A population of white-footed mice becomes severely overpopulated in a habitat that has been disturbed by human activity. Sometimes intrinsic factors cause the population to increase in mortality and cause lower reproduction rates to occur in reaction to the stress of overpopulation. Which of the following is an example of intrinsic population control?
A) Owl populations frequent the area more often because of increased hunting success.
B) Females undergo hormonal changes that delay sexual maturation, and many individuals suffer depressed immune systems and die due to the stress of overpopulation.
C) Clumped dispersion of the population leads to increased spread of disease and parasites, resulting in a population crash.
D) All of the resources (food and shelter) are used up by overpopulation, and much of the population dies of exposure and/or starvation.
F) A) and C)
Correct Answer

verified
Correct Answer
verified
Multiple Choice
Which of the following statements regarding the future of populations in developing, less industrialized countries are correct?
A) The reproductive rates are predicted to remain below replacement level. and the overall population size will increase dramatically.
B) Survivorship will increase and the fertility rate is predicted to remain high, especially in some regions.
C) Survivorship will increase, overall population size will increase dramatically, and the fertility rate is predicted to remain high, especially in some regions.
E) All of the above
Correct Answer

verified
C
Correct Answer
verified
Multiple Choice
Which of the following causes populations to shift most quickly from an exponential to a logistic population growth model?
A) favorable climatic conditions
B) removal of predators
C) decreased death rate
D) competition for resources
F) None of the above
Correct Answer

verified
Correct Answer
verified
Multiple Choice
Use the hypothetical or idealized survivorship curves in the figure to answer the following question. 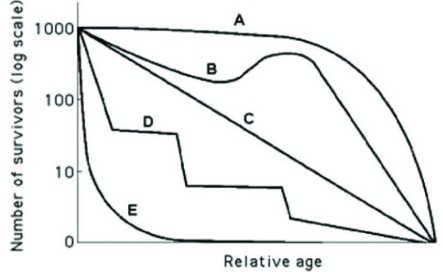 Which of the following curves describes survivorship that is most typical in marine fish or mollusks?
A) A
B) B
C) C
D) E
F) A) and D)
Correct Answer

verified
D
Correct Answer
verified
Multiple Choice
Which of the following is an energetic trade-off in natural selection?
A) choosing how many offspring to produce over the course of a lifetime and how long to live
B) producing large numbers of gametes when employing internal fertilization versus fewer numbers of gametes when employing external fertilization
C) increasing the number of individuals produced during each reproductive episode and a corresponding decrease in parental care
D) high survival rates of offspring and the cost of parental care
F) B) and D)
Correct Answer

verified
Correct Answer
verified
Multiple Choice
An undergraduate student research assistant is attempting to help estimate the population size of a prairie dog colony, and completes several counts using mark-recapture methods. Which factors, other than reproductive rate and survivorship, would be necessary to consider when using the data to construct a life table and estimate the population size and future over time?
A) immigration or emigration of individuals to and from the population
B) reproductive rate and survivorship data are sufficient, nothing else is necessary
C) population size of a nearby colony
D) whether the burrows are clumped, uniform, or randomly distributed across the landscape
F) A) and D)
Correct Answer

verified
Correct Answer
verified
Multiple Choice
Use the graphs to answer the following question. 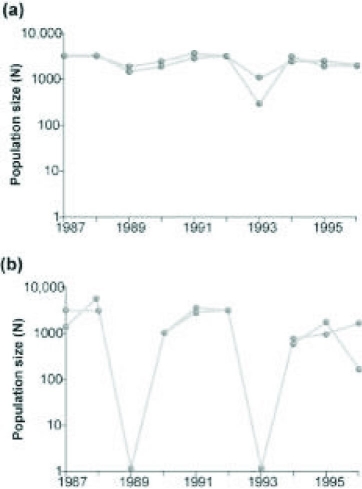 Graph (b) in the figure shows the normal fluctuations of a population of grouse, a ground-nesting bird. Assuming graph (a) in the figure is the result of some experimental treatment in the grouse population, what can be concluded?
A) The experimental treatment intensified the population cycling.
B) The experimental treatment did not affect population cycling in this species.
C) The experimental treatment has most likely identified the cause of population cycling.
D) The experimental treatment involved the introduction of a predator of the bird.
F) A) and D)
Correct Answer

verified
Correct Answer
verified
Multiple Choice
In 2019, the United States Census Bureau reported the various components of population change as estimated below. ∙ One birth every 8 seconds ∙ One death every 11 seconds ∙ One international migrant (net of immigrants versus emigrants) every 33 seconds ∙ Net gain of one person every 17 seconds During that year, which of the components was having the second largest effect on population growth?
A) The immigration rate
B) The emigration rate
C) The birth rate
D) The death rate
F) All of the above
Correct Answer

verified
Correct Answer
verified
Multiple Choice
Use the graph to answer the following question. 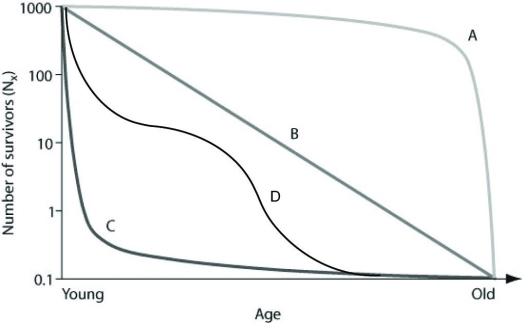 In the figure, which of the following survivorship curves is most consistent with humans who are living in developed countries where most of the population has consistent access to resources such as food, water, shelter and health care?
A) curve A
B) curve B
C) curve C
D) curve D
F) B) and C)
Correct Answer

verified
Correct Answer
verified
Multiple Choice
A researcher is studying two old-growth forests on the coast of northern California: One is undisturbed, while the other is being disturbed from logging and harvesting of the wood by a lumber company. In which region are more species likely to experience exponential growth, and why?
A) old-growth forest, because of stable conditions that would favor exponential growth in the forest
B) old-growth forest, because each of the species is well established and can produce many offspring
C) logged forest, because the disturbed forest affords more resources allowing some species populations to grow rapidly
D) logged forest, because the various populations are stimulated to a higher reproductive potential
F) All of the above
Correct Answer

verified
Correct Answer
verified
Multiple Choice
Use the hypothetical or idealized survivorship curves in the figure to answer the following question. 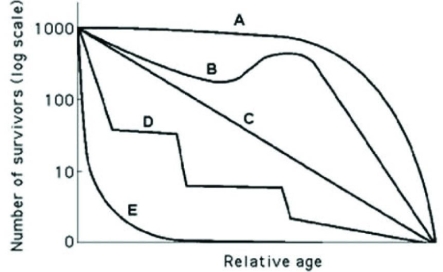 Which statement best explains survivorship curve B?
A) It is likely a species that provides little postnatal care, but lots of care for offspring during midlife as indicated by increased survivorship.
B) This curve is likely for a species that produces lots of offspring, only a few of which are expected to survive.
C) It is likely a species where no individuals in the cohort die when they are at 60-70% relative age.
D) Survivorship can only decrease; therefore, this curve could not happen in nature.
F) A) and B)
Correct Answer

verified
Correct Answer
verified
Multiple Choice
Use the graph to answer the following question. 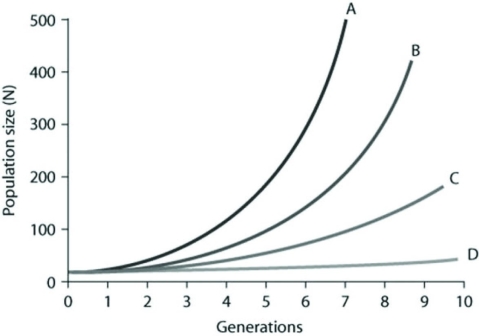 In the figure, curves A-D depict per capita rate increases (r) . Which of the following best explains the difference between the shapes of these curves?
A) The population growth is logistic as generations continue to form.
B) The growth is exponential for curves A and B, but because population growth for C and D is slower, it is considered logistic.
C) Population growth within each curve gets steeper as time passes because growth depends on both per capita rates of increase and current population size.
D) Curve A has the fastest rate of logistic growth.
F) A) and B)
Correct Answer

verified
Correct Answer
verified
Multiple Choice
In a field of corn or lettuce on a farm, plants are cultivated with uniform spacing that will maximize plant growth. In natural habitats however, a uniform pattern of dispersion is much less common. While exceptions do exist, for example in populations of creosote bush in the desert, which of the following best explains why natural populations of plants usually exhibit clumped or random dispersion patterns?
A) Patterns of higher soil moisture, the concentration of soil nutrients, and the distribution of seeds from parent plants may be highly variable.
B) Precipitation across landscapes, especially mountain ranges, is uniform.
C) The competitive interactions between individuals of the same population usually lead to such dispersion patterns.
D) Since nearly all plants are wind-pollinated, the direction of breezes can affect whether plants will produce seeds.
F) A) and B)
Correct Answer

verified
A
Correct Answer
verified
Multiple Choice
In April 2019, the population in the United States was approximately 328,545,050 people. If the estimated growth rate of the population in 2019 was 0.70%, which of the following is the best estimate of the population in April 2020?
A) 567,760,000 328,775,032
B) 335,677,020
C) 330,844,865
D) 351,543,204
F) B) and C)
Correct Answer

verified
Correct Answer
verified
Multiple Choice
Which of the following is consistent with a recent study of ecological footprints?
A) Earth's carrying capacity would increase if per capita meat consumption increased
B) current demand by industrialized countries for resources is much smaller than the ecological footprint of those countries
C) it is not possible for technological improvements to increase Earth's carrying capacity for humans
D) the ecological footprint of the United States is large because per capita resource use is high
F) All of the above
Correct Answer

verified
Correct Answer
verified
Multiple Choice
Use the figure to answer the following question. 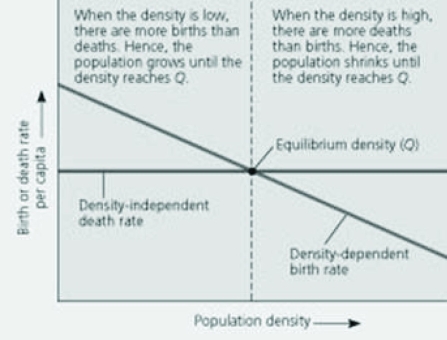 In the figure, one could depict a different scenario where the death rate per capita was dependent upon (and positively correlated with) the density of the population, and the birth rate was instead density independent. Which of the following would occur as the density of the population increased?
A) the death rate would decrease and the birth rate would decrease
B) the death rate would increase and the birth rate would decrease
C) the death rate would increase and the birth rate would remain stable
D) the death rate would remain stable and the birth rate would increase
F) B) and D)
Correct Answer

verified
Correct Answer
verified
Multiple Choice
Which of the following statements about human populations in industrialized countries is correct?
A) Life history is r-selected.
B) The population has undergone demographic transition and age distribution is relatively uniform.
C) Life history is r-selected, the population has undergone the demographic transition, and age distribution is relatively uniform.
D) The survivorship curve is a Type III.
F) A) and C)
Correct Answer

verified
Correct Answer
verified
Showing 1 - 20 of 73
Related Exams